If you’re interested in following trends, you’ll identify a currency pair with more uptrend or downtrend than others. That makes sense for a trader trading in short time frames, say an hour, than those who wait out the long term. But short terms form too many false trade setups, making it hard for you to locate price moves for pairs that work.
While some currency pairs form stable, longer trends compared to others, these are mainly trade-able in the long term. You’ll be looking for two types of trends, namely;
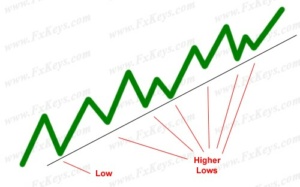
Uptrends form when the price goes up and creates higher lows, which are higher than the previous.

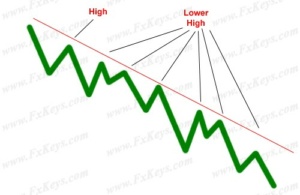
Downtrends create lower highs or those that are lower than previous highs.

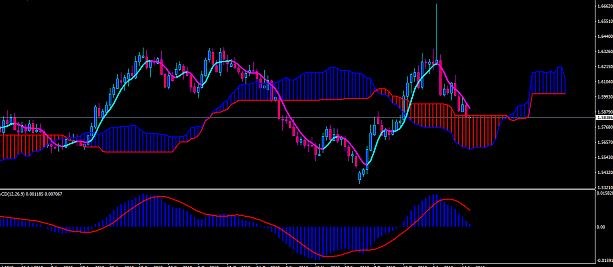
It’s not easy to distinguish a trending market, mainly because of strange price behaviours even on long time frames. To easily locate trends, traders use some indicators or tools that help distinguish the price movement of trending currency pairs. The most famous of these indicators are the Simple Moving Averages, and the 20SMA, the 50SMA, and the 200SMA are the most common.
SMAs give you a mathematical depiction of the start of an obvious currency pair trend. For instance, the Golden Cross happens when the 50SMA moves above the 200SMA, indicating an upward trend. Its opposite is the Death Cross, when the 50SMA crosses below the 200SMA, showing the development of a downward trend. You can tell that a currency pair is forming a trend to tailor a flowing to your strategy is through volatility.